- FORUM
- PROJECTS
- ABOUT US
- RESOURCES
- CONTACT US
- FORUM
- PROJECTS
- ABOUT US
- RESOURCES
- CONTACT US
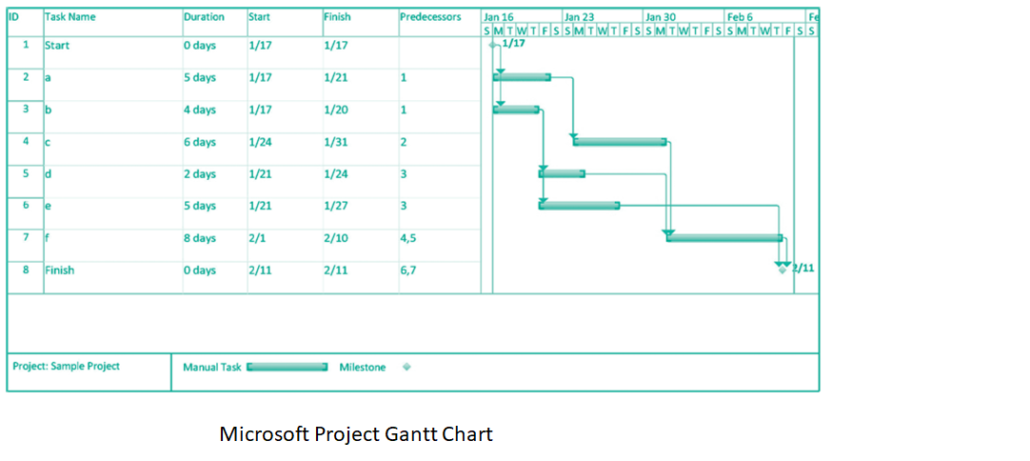
Project Scheduling Techniques Microsoft Project Gantt Chart
Project scheduling techniques are used to plan, execute, and monitor the progress of a project. Two commonly used project scheduling techniques are Microsoft Project and Gantt charts.
Microsoft Project is a software application that is used to manage projects, allowing you to plan, schedule, track progress, and analyze the performance of your project. The application allows you to create a project plan by defining tasks, estimating task durations, and assigning resources to the tasks. Microsoft Project also allows you to create a project timeline, set dependencies between tasks, and track the progress of the project.
A Gantt chart is a visual representation of a project schedule that displays the timeline of the project and the individual tasks that make up the project. The chart shows the start and end dates of each task, as well as the duration of each task. Gantt charts also show the dependencies between tasks, allowing you to identify critical paths in the project.
To create a Gantt chart, you can use software applications like Microsoft Excel or Microsoft Project. The steps involved in creating a Gantt chart include:
- Define the project tasks: Break down the project into smaller tasks and define the start and end dates for each task.
- Determine task dependencies: Identify which tasks must be completed before other tasks can begin.
- Determine task durations: Estimate the amount of time each task will take to complete.
- Create the Gantt chart: Use a software application to create a visual representation of the project schedule, showing the timeline of the project and the individual tasks.
- Update the Gantt chart: Regularly update the Gantt chart to track the progress of the project and make any necessary adjustments to the schedule.
Overall, both Microsoft Project and Gantt charts are valuable tools for project scheduling and management, providing a clear and visual representation of project timelines, tasks, and progress.

Register & Download PDF for Educational Purposes Only
Project Planning and Management Study notes for M. plan Sem-II

project planning and management.pdf
Register as member and login to download attachment [pdf] by right-click the pdf link and Select “Save link as” use for Educational Purposes Only
FD Planning Community Forum Discussion
- What different types of Projects can be taken up for Urban Development?
- Project Appraisal of city level projects
- Demand Forecasting methods for Project
- Location analysis for a project
- Role and Responsibilities of Govt. Organizations in project management
- Principles of activity planning
- Defining Activities of activity planning
- Sequencing Activities of Activity planning
- Estimating Activity Resources of Activity planning
- Develop Schedule of Activity planning
Disclaimer
Information on this site is purely for education purpose. The materials used and displayed on the Sites, including text, photographs, graphics, illustrations and artwork, video, music and sound, and names, logos, IS Codes, are copyrighted items of respective owners. Front Desk is not responsible and liable for information shared above.


