Trip generation rates can vary widely depending on the type of land use and other factors such as location, density, and access to transportation modes. Here are some common trip generation rates for different land uses:
- Single-family residential: 7-10 trips per day per dwelling unit, with higher rates during peak periods.
- Multifamily residential: 4-6 trips per day per dwelling unit, with higher rates during peak periods.
- Retail: 8-12 trips per 1,000 square feet of floor area per day, with higher rates for larger stores and during peak periods.
- Office: 3-4 trips per 1,000 square feet of floor area per day, with higher rates during peak periods.
- Industrial: 1-2 trips per 1,000 square feet of floor area per day, with higher rates during peak periods.
- Hotel/motel: 10-15 trips per room per day, with higher rates during peak periods.
- Healthcare: 5-8 trips per 1,000 square feet of floor area per day, with higher rates during peak periods.
It’s important to note that these trip generation rates are general guidelines and may not reflect the specific conditions of a given development or location. Other factors, such as the availability and quality of transportation options, may also influence trip generation rates. Therefore, it’s important to conduct site-specific analyses to determine the appropriate trip generation rates for a particular development or land use.
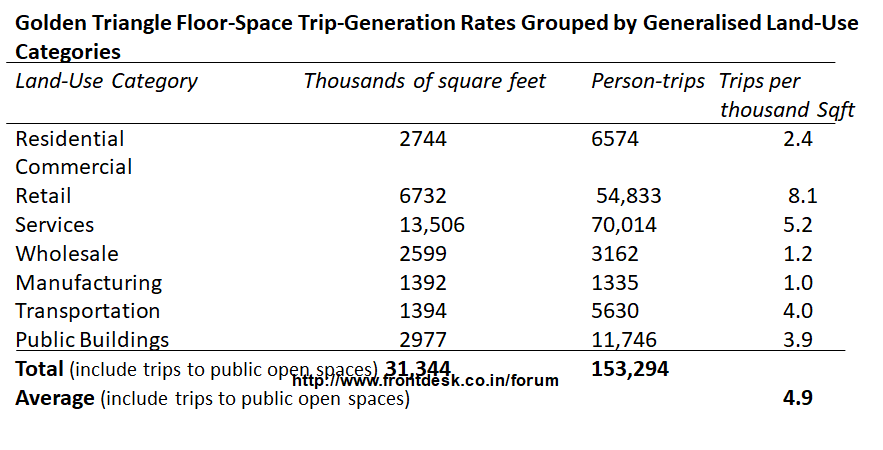
Trip rate analysis refers various models those are based on the determination of the average trip-production or trip-attraction rates associated with the trip generators within the region. An example is given in Table to display the trip generation rates associated with various land-use categories in Downtown Pittsburgh, which are obtained by one of the very first major urban studies.
Golden Triangle Floor-Space Trip-Generation Rates Grouped by Generalised Land-Use Categories
The Golden Triangle Floor-Space Trip-Generation Rates are a set of guidelines used for estimating trip generation rates for different land uses in the United Kingdom. The rates are grouped by generalized land-use categories and are based on data collected from a variety of sources, including surveys of individual developments and data from national transportation databases. Here are the trip-generation rates for some of the common generalized land-use categories in the Golden Triangle:
- Residential:
- Single-family homes: 10 trips per dwelling unit per day
- Apartments: 5 trips per dwelling unit per day
- Retail:
- Large food stores: 12-18 trips per 1,000 sq. ft. of floor area per day
- Small food stores: 10-15 trips per 1,000 sq. ft. of floor area per day
- General merchandise stores: 5-10 trips per 1,000 sq. ft. of floor area per day
- Office:
- General office: 2.5-4 trips per 1,000 sq. ft. of floor area per day
- Professional office (e.g. law firms, accounting firms): 3-6 trips per 1,000 sq. ft. of floor area per day
- Industrial:
- Warehousing: 0.5-1 trip per 1,000 sq. ft. of floor area per day
- Manufacturing: 1-3 trips per 1,000 sq. ft. of floor area per day
- Hotel:
- Budget hotels: 10-15 trips per room per day
- Luxury hotels: 20-25 trips per room per day
It’s important to note that these trip-generation rates are just guidelines and should be adjusted based on the specific characteristics of each development or land use. Factors such as location, access to transportation modes, and the presence of other nearby land uses can all affect trip generation rates.
Travel demand Analysis based on land-use
Land use and Transport Planning home page
Download Study Notes PDF
Land use and Transport Planning.pdf
Register as member and login to download attachment use this only for Educational Purpose
FD Planning Community Forum Discussion
- Land Use Transport Integration and Density of Urban Growth Toolkit
- Integration of Land Use and Transport Planning
- Introduction – Modelling Transport – Ortuzar Willumsen
- Mathematical Prerequisites from Modelling Transport
- data and space from Modelling Transport
- Trip Generation Modelling from Modelling Transport
- Modal split and direct demand models from Modelling Transport
- Discrete choice models from Modelling Transport
Disclaimer
Information on this site is purely for education purpose. The materials used and displayed on the Sites, including text, photographs, graphics, illustrations and artwork, video, music and sound, and names, logos, IS Codes, are copyrighted items of respective owners. Front Desk is not responsible and liable for information shared above.
2 Comments
[…] Trip generation rates of different land uses […]
What is the reference for these trip rates