
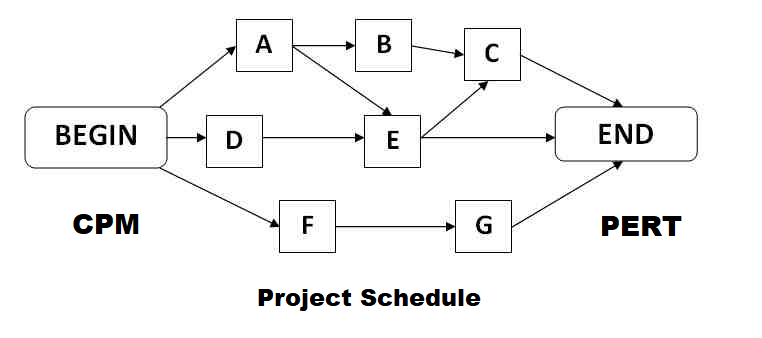
Project Evaluation and Review Technique (PERT)
June 2, 2021
PERT (Program Evaluation and Review Technique) is a project management technique used to analyze and manage the tasks involved in completing a project. It is a tool that can help managers to plan, monitor, and control project activities.
The PERT technique involves breaking down a project into smaller, more manageable tasks and estimating the time required to complete each task. PERT uses statistical methods to analyze the estimated durations of the tasks and provides a range of possible completion dates for the project. PERT also identifies the critical path, which is the sequence of tasks that must be completed on time to ensure the project is finished on schedule.
Like CPM, PERT is also a network based planning tool developed by US Navy in 1958. It was used for scheduling Polaris Missile Project.
•But, unlike CPM, PERT is used for novel projects like research and development (R & D) where it is difficult to estimate activity duration accurately.
•CPM is used for projects with prior experience such as civil engineering works.
•It is a probabilistic approach for estimating project duration of an activity and event-oriented network diagram.
•PERT is preferred for those projects in which correct time determination for various activities cannot be made.
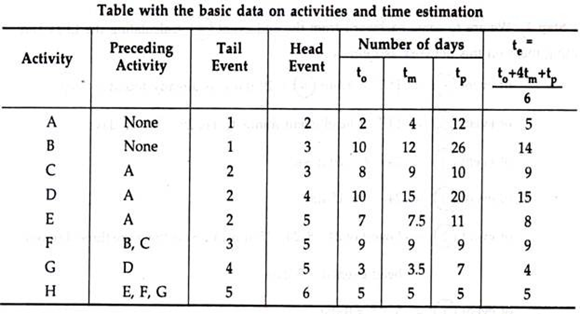
PERT uses three-time estimate for each activity with a view to overcoming uncertainty in time estimates.
Optimistic time estimate (t0):
It is minimum time i.e. the shortest possible time required to complete the activity in ideal conditions.
Pessimistic time estimate (tp):
Maximum time required to complete the activity in the worst condition.
Most probable time estimate (tm):
Time required to complete the activity in normal circumstances.
Expected time (te)
From three time estimates, we calculate average time i.e. expected time (te) using the following formula.
te=(t0+4 tm+tp)/6
For example when to = 3, tp = 9 and tm = 6 then, as per the formula,
te =to + 4 x tm + tp/6= 3+ 24 + 9/6 = 6;
when the three estimates are placed in time scale.
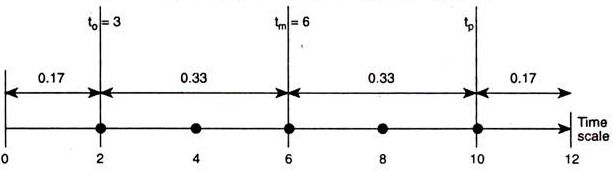
When the probability follows beta distribution (as assumed in PERT), and in the scale of time, time units 12 represents 100 per cent probability, then time units 6 is 0.5 or 50 per cent probability. The most likely estimate is a probability of 0.5. As we have noted in the averaging formula the weightage for to tm and tp are 1, 4, and 1, respectively.
The 0 to 2 in the time scale representing 1/6 th = 0.17,
2 to 6 in the time scale representing 4/12 th = 1/3 th =0.33,
6 to 10 is 0.33 10 to 12 is 0.17.
Therefore, the probability of tm will lie between 2 to 10 i.e. 0.33 + 0.33 = 0.66
PERT considers te as more probable time estimate for activities and then the network construction and the critical path is drawn considering te-s for the respective activities.
The estimate of te as explained here is more reliable as it takes into account the longest and the shortest possible time estimates also and it provides a probability of 50 per cent.
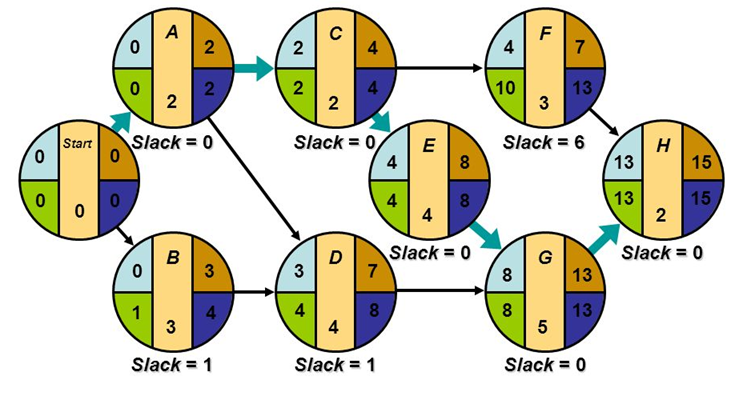
Once the te is worked out for each of the activities the network can be constructed following the same principle
The network is constructed in PERT as per the te developed from the three different time estimates as shown below:
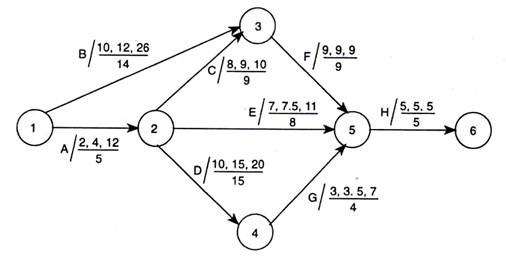
All the different estimates of time as well as the worked out te are shown in the network diagram against the relevant activity. There is, however, no specific rule for writing such estimates on the network.
We will now redraft the network (to have a cleaner diagram) with only the te and work out the Critical Path as per the following steps:
Step 1. Calculating EST s and plotting them on the network as detailed below:
event ① = start with 0;
event ② = EST of tail +te i.e. 0+5=5 days
event ③= 0+ 14 days;
event ④ = 5+15=20 days
event ⑤ = highest of 14 +9, 5+8, and 20+4(as there are different tail events) = 24 days;
event ⑥ = 24+5=29 days
Step 2. We are to come backward from the end event ⑥.
Calculating the LFTs and plotting them on this network as follows:
of event ⑥ = EST of event (6) = 29 days, as already found in Step 1;
of event ⑤ = LFT of head event minus te, i.e. 29 – 5 = 24 days;
of event ④ = 24 – 4 = 20 days;
of event ③ = 24 – 9 = 15 days;
of event ② = lowest of 24 – 8,20 – 15 and 15-9 (as there are three different head events) = 5 days;
of event ① = 5-5 = 0 day.
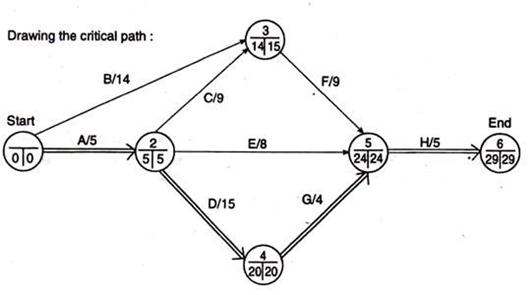
With the ESTs and LFTs calculated as detailed in Step 1 and Step 2 above we will produce the network diagram as:
EST = Early start Time
LFT = Late finish Time
Step 3:
We know the events having same EST and LFT are on the critical path and now we find those are 1, 2, 3, 4, 5 and 6. The critical path is now shown by double-line arrows and the project duration is 29 days.
This is subject to the random variation of the actual performance time as against te (time estimates for PERT) of 5, 15, 4 and 5 time units for activities on the critical path.
Therefore, the actual time to perform the four activities A, D, G and H represents the time to complete the project and PERT works out by means of statistical theory the probability of meeting the time target.
Example of PERT used for Public infrastructure projects
PERT (Program Evaluation and Review Technique) can also be applied to public infrastructure projects, such as the construction of a highway or a bridge. Here is an example of how PERT can be used for a highway construction project:
- Task 1: Survey and feasibility study – 3 months
- Task 2: Environmental Impact Assessment – 6 months
- Task 3: Design and engineering – 12 months
- Task 4: Procurement of materials and equipment – 3 months
- Task 5: Clearing and grading the site – 6 months
- Task 6: Construction of bridges and overpasses – 12 months
- Task 7: Paving and surfacing the highway – 6 months
- Task 8: Signage and striping – 2 months
The first step in using PERT for this project would be to construct a network diagram that shows the dependencies between the tasks. For example, Task 3 (design and engineering) cannot begin until Task 1 (survey and feasibility study) and Task 2 (environmental impact assessment) have been completed.
Once the network diagram has been constructed, the project manager can estimate the time required to complete each task, taking into account any uncertainties and possible delays. For example, Task 6 (construction of bridges and overpasses) may be subject to delays due to weather or unexpected construction issues.
Next, the project manager can use PERT to determine the critical path – the sequence of tasks that must be completed on time to ensure that the project is completed on schedule. The critical path for this project might be:
Task 1 (survey and feasibility study) → Task 2 (environmental impact assessment) → Task 3 (design and engineering) → Task 6 (construction of bridges and overpasses) → Task 7 (paving and surfacing the highway)
By identifying the critical path, the project manager can focus resources and attention on these tasks to ensure that they are completed on time. The project manager can also use PERT to determine the earliest and latest start and finish times for each task, and to identify any slack time – the amount of time by which a non-critical task can be delayed without affecting the overall project schedule.
Using PERT can help project managers to better plan and manage public infrastructure projects, reducing the risk of delays, cost overruns, and other issues.
Register & Download PDF for Educational Purposes Only
Project Planning and Management Study notes for M. plan Sem-II

project planning and management.pdf
Register as member and login to download attachment [pdf] by right-click the pdf link and Select “Save link as” use for Educational Purposes Only
Disclaimer
Information on this site is purely for education purpose. The materials used and displayed on the Sites, including text, photographs, graphics, illustrations and artwork, video, music and sound, and names, logos, IS Codes, are copyrighted items of respective owners. Front Desk is not responsible and liable for information shared above.